Treasury First – Mid Week Macro Report 22 September 2021
Treasury First – Mid Week Macro Report 22 September 2021
The Chinese Evergrande Group is continuing to dominate markets with the latest news that it will pay its interest coupons tomorrow that are maturing on its onshore bonds – nothing has been mentioned regarding the interest repayments on their off-shore bonds. The news has sparked another leg higher in the risk rally off of Monday’s low – particularly seen in global equities. However, the risks around the group are still elevated and there is some concern that foreign debt will not be serviced. The real concern is how the Chinese authorities will deal with this issue and if it can spill over into the wider Chinese property market and into global credit markets. The markets are being helped in their risk on approach today ahead of the other key event this week, the FOMC meeting – this evening at 7.00 pm London time. The FOMC is expected to leave its rates unchanged but may signal a more positive shift in economic sentiment and Covid-19 cases as setting up the market for a taper of asset purchases. An official announcement of this is not expected until November at the earliest but the market will look for hints that a taper is on the cards in order to position for such an event. The other interesting element of tonight’s meeting will be the release of the new economic projections from the committee members, taking in 2024. The thing to watch here is the ‘’dot plot’’ – the projections of each member of the committee on the interest rate hiking cycle. All eyes on whether enough members see a lift-off to interest rates by the end of 2022 – this would be interpreted as hawkish by the markets. At present, the market is relatively calm with an upside bias. In the FX space, the volatility in recent days has subsided to some degree and markets are awaiting developments from the FOMC.
EURUSD
The EURUSD FX pair is trading at 1.1730 after breaking below the 50 SMA as support and testing lower to the 1.1700 area on Monday. Price tested resistance at the 1.1750 level in July creating a lower area of support and this is being tested as near term resistance. The pair is consolidating around 1.1800 running into resistance around 1.1900 and support around 1.1700/1.1650. Price is using the 50 SMA area as resistance in the short term at 1.1800. A confirmed breakout above this level and the 100 SMA, opens the way to resistance at the 1.1875 area followed by 1.1900. The 1.1950 area may then be resistive as the 200 SMA followed by the 1.2000 area. Alternatively, a move back down under 1.1700 opens the way to support at 1.1650. This area of support is followed by further supports at 1.1600 and 1.1570.

Wall St 30 Index
The Wall St 30 Index created a high at 35640.00 last month and is now testing the support area of the last higher low around 33750.00 after breaking the rising trend line at 34900.00 area earlier this month. The price tried to hold onto the 100 SMA last week but support gave way at 34500.00. If the market breaks above the resistance area at 34200.00, the way opens back to 3450.00. Further resistance comes onto the chart at 34800.00 and 35000.00. Alternatively, a move back below 34000.00 signals a test on the support at 33800.00 The 33600.00 area then becomes supportive followed by the 33000.00 round number level. Below this level, the 32566.00 area would be used as support along with 32030.00 as a significantly higher low.

Gold
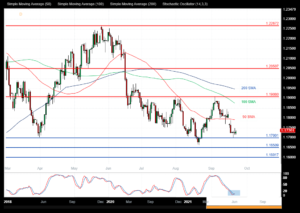
The Gold chart is showing how the pair has consolidated over recent weeks after reaching a lower high at 1916.00 in June and finding support at 1667.00 in August. With price now trading at 1775.00 as it consolidates after bouncing from support at 1741.60. The 1800.00 area is expected to act as resistance in the short term as it contains the moving averages. A break above this level would find resistance ahead of 1835.00. A continued move higher finds more resistance around 1865.00 and 1877.00. A breakout from there opens the way to 1900.00 and 1916.00. Alternatively, a move back down under 1741.00 would find support at 1700.00 and 1667.00 as the August low. A loss of this level extends the control of sellers and opens the way to a test on the 1600.00 area.

