Mid Week Macro Report 8th September 2021
Treasury First– Mid Week Macro Report 8th September 2021
The financial markets experience a ‘’risk off’’ move yesterday after US markets returned from the Labour Day holiday. This risk off move has extended into the opening of the European session on Wednesday with a fall in risk assets such as stocks and crypto currencies. Following on from the US Non-Farm Payrolls report last week, the initial reaction in markets centred on the prospect of a delay to the FED’s taper of asset purchases. However, as time has progressed the market has become more bearish, with the narrative now shifting towards a broader global slow down. These markets have the ability to shift their macro outlook in a matter of days. What has added additional woes this morning is FED member Bullard’s interview with the Financial Times. He still argues that the FED should taper sooner rather than later. He said that he was looking for job gains to average out around 500k per month this year. He said that the jobs numbers are going to bounce up and down, adding that the jobs are there, but workers may not want the jobs right now. He said that the FED needs to have the option to raise rates in 2022. He said that in order to achieve this, the FED needs to wrap up asset purchases by the end of Q1 2022. He added that another reason to taper is the incipient housing market bubble. More FED speakers are scheduled to engage with the press this week and it will be interesting to see if their pre-Jackson Hole hawkish stance remains in tactic given Powell’s speech and the lower than expected NFP figure last Friday.
One has to argue that last week’s weak employment figures out of the US have produced some strange reactions in financial markets – the back end of the US curve has rallied, stocks have sold off and the Dollar has moved higher versus EM and G10 currencies. A sustained move in any direction, in any asset classes, bar US stock markets has been hard to come by this summer, so we wait in anticipation to see if this move has legs. Of course, all eyes turn to next week and the CPI figures out of the US – potentially giving us an insight into whether inflation is transitory or not…..
USDCAD
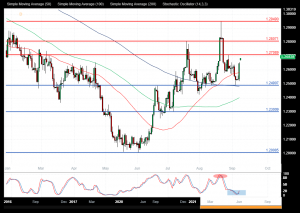
The USDCAD FX pair is trading at 1.2680 after testing the 50 SMA as resistance and breaking higher yesterday. The price tested resistance at the 1.2800 level in July creating a lower area of resistance and then sold off to the 1.2430 support zone. The pair is trending higher since establishing the 1.2000 area as support in June. Price is using the 1.2700 area as resistance in the short term. A confirmed breakout above this level opens the way to resistance at the 1.2800 area followed by 1.2820. The 1.2900 area may then be resistive followed by the highs above 1.2950. Alternatively, a move back down under 1.2600 opens the way to support at 1.2500. This area of support is followed by further supports at 1.2490 and 1.2300.

UK 100 Index
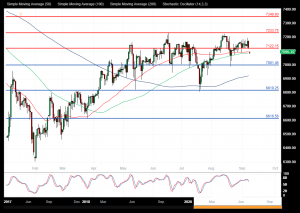
The UK 100 Index created a lower high at 7233.00 in June and is now testing the 7080.00 area as the price action remains bullish. If the market breaks above the resistance area at 7122.00, the way opens to 7200.00. Further resistance comes onto the chart at 7250.00 and 7350.00. The market is creating higher highs and higher lows using the support at 7000.00. Alternatively, a move back below 7000.00 signals a test on the support at 6920.00 The 6800.00 area then becomes supportive followed by 6700.00. Below this level, the 6616.00 area would be used as support as a significantly higher low.

Copper
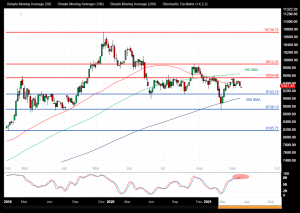
The Copper chart is showing how the industrial metal has traded lower over recent weeks after reaching a high at 10730.00 in May. With price now trading at 9300.00 as it consolidates after bouncing from support at 8740.00. The 9425.00 level is expected to act as resistance in the short term. A break above this level would find resistance at the 50 SMA around 9450.00. A continued move higher finds more resistance around the 9554.00 and the 100 SMA around 9650.00. A breakout from there opens the way to 9920.00 and 10000.00. Alternatively, a move back down under 9130.00 would find support at 8740.00 as the August low. A loss of this level extends the control of sellers and opens the way to a test on 8185.00 and the 8000.00 area.

