Mid Week Macro Report – 1st September 2021
Treasury First – Mid Week Macro Report 01 September 2021
The Jackson Hole symposium last week created headlines in the markets with a slew of hawkish FED members prepping market participants before FED Chair Powell spoke on Friday. The difference in tone between the FED Chair and his hawkish colleagues was enough to dampen any market fears of a taper tantrum (reducing QE). Powell gave a master class in walking a fine line between introducing the need for a taper and downplaying the risks to the market of elevated asset prices. He used the Covid-19 virus as a reason to delay making a decision on tapering in the immediate future. He also raises the bar for the start of rate hikes, by assuring the market that any signs of tapering of QE does not at all indicate a potential start of rate hikes any time soon. Yesterday it was the turn of the ECB to suggest tapering asset purchases with policymakers highlighting the rise in inflation and the much improved economic landscape. We had Lane last week, followed by two members of the ECB this week both noting higher inflation in the Eurozone and the need to address the issue. The PEPP facility would be centre stage in line for a taper, with the programme set to expire in March. Again the ECB wants to disconnect asset purchase programmes from the rate hike cycle. Equity markets sold off on the ECB comments but they have stabilized overnight. We also saw a sharp selloff in European Govt bond markets, led by Italy on these ECB comments, sending yields higher over the course of the week and in turn EUR/USD.
This week’s major risk event will be US Non-Farm Payrolls report on Friday. In many respects, this is a bigger market event than Jackson Hole and should bring with it huge volatility on Friday. As mentioned above the messages from the Fed have been mixed – with Chair Powell on one side of the spectrum and the hawks on the other. Friday’s employment report will give either side further ammunition for their central argument and should dictate the direction of markets into the final quarter of the year. A strong figure on Friday – above 725k and an unemployment rate below 5.2% would see the hawks strengthen their case – the Fed meeting at the end of Sept would come into play. On the back of this stock markets should sell off, US yields would rally, along with the Dollar, and Gold should sell off. However, anything disappointing – below 725k and above 5.2% would see the complete opposite, with stocks markets continuing their powerful move higher. We cannot over emphasise the importance of this event and the large market moves that it will bring tomorrow.
GBPUSD
The GBPUSD FX pair is trading at 1.3753 after testing the 50 SMA as resistance yesterday. Price tested resistance at the 1.3980 level in July creating a lower area of resistance and then sold off to the 1.3600 support zone. The pair is trending since establishing the 1.4250 area as resistance in June. Price is using the 1.3800 area as resistance in the short term. A confirmed breakout above this level and the 50 SMA opens the way to resistance at the 1.3900 area followed by 1.3980/1.4000. The 1.4085 area may then be resistive followed by the highs above 1.4200. Alternatively, a move back down under 1.3700 opens the way to support at 1.3600. This area of support is followed by further supports at 1.3560 and 1.3425.

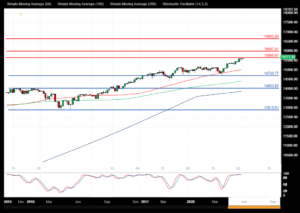
NAS 100 Index
The NAS 100 Index created a new high at 15697.00 yesterday and is now testing the 15600.00 area, however, the price action remains overall bullish. If the market breaks above the resistance area, the way opens to 16000.00 level into year end. Further resistance comes onto the chart at 16600.00 and 17000.00. The market is creating higher highs and higher lows using the support at 14720.00. Alternatively, a move back below 15000.00/14720.00 signals a test on the support at 14000.00 The 13860.00 area then becomes supportive followed by 13500.00. Below this level, the 12910.00 area would be used as support as a significantly higher low.

Silver
The Silver chart is showing how the precious metal has traded lower over recent weeks with the price now trading at 2382.00 as it consolidates after bouncing from support at 2211.00. The 2425.00 level is expected to act as resistance in the short term. A break above this level would find resistance at the 50 SMA around 2475.00. A continued move higher finds more resistance around the 2600.00 as the 100 SMA crosses down under the 200 SMA. Alternatively, a move back down under 2290.00 would find support at 2211.00 as August’s low. A loss of this level extends the control of sellers and opens the way to a test on 2170.00 and the 2122.00 area.

